Post-Secondary Enrollment and Credit Completion in Georgia
May 27, 2015
By Brandon Wilkerson
Information on the number and percentage of students who graduate from high school is readily available, but much less is known about where those students end up after high school. This education update examines the post-secondary enrollment and credit completion rates of Georgia high school graduates over a three-year period. The data are drawn from the c(11) and c(12) reports that the Governor’s Office of Student Achievement (GOSA) publishes on its annual Report Card.[1] This information is provided by GA•AWARDS (Georgia's Academic and Workforce Analysis and Research Data System), which is the statewide longitudinal data system housed at GOSA.
The c(11) tracks public high school graduates from a given year and provides information on the number who enroll in a post-secondary institution anywhere in the nation within 16 months of graduation. The most recent report provides information on the class of 2012.[2] The c(12) tracks public high school graduates from a given year who enroll in a post-secondary institution in Georgia and earn at least 24 credit hours (i.e., approximately one year of college instruction) within their first two years.[3] The most recent report provides information on the class of 2010.[4] Because the c(12) does not include students who enrolled out of state, the two reports are not directly comparable.
Key Findings
|
Trends in College Enrollment
To establish trends in college enrollment, this education update examines data for the classes of 2010, 2011, and 2012.[5] Students are counted as enrolled if they entered a post-secondary institution within 16 months of high school graduation.
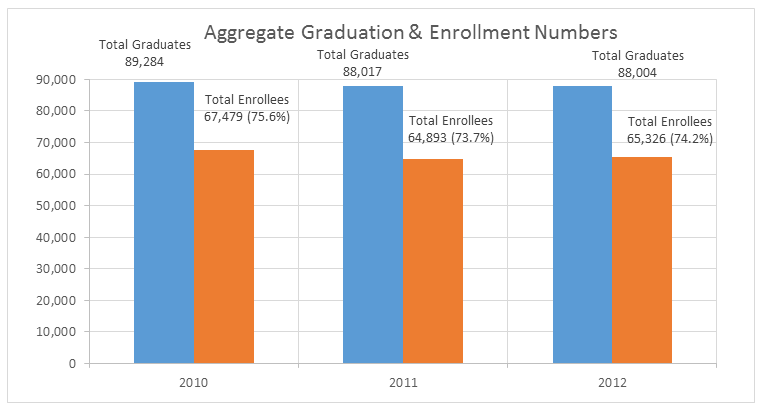
The aggregate enrollment rate fell from 75.6% for the class of 2010 to 73.7% for the class of 2011. It subsequently rose to 74.2% for the class of 2012—representing a decline of 1.4 percentage points over the three-year period.
Figures 1 shows Georgia students’ aggregate enrollment data.[6]

Enrollment by Gender
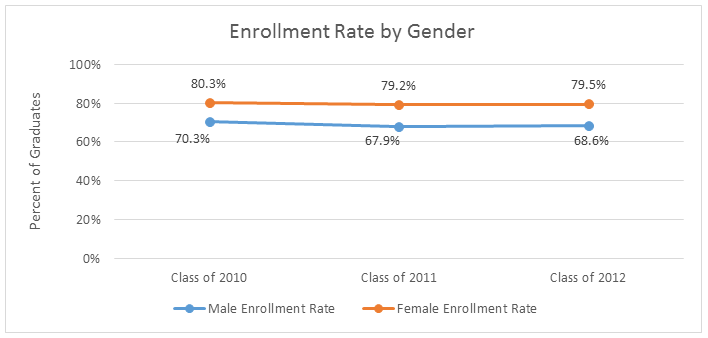
Female graduates enrolled at a higher rate than male graduates for all three cohorts. Female graduates also outnumbered male graduates. In the 2012 cohort, female students made up 51.9% of all graduates, but accounted for 55.5% of all enrollees. The female enrollment rate was 79.5%, compared to 68.6% for males.
Figure 2 shows enrollment data by gender.
Enrollment by Race/Ethnicity
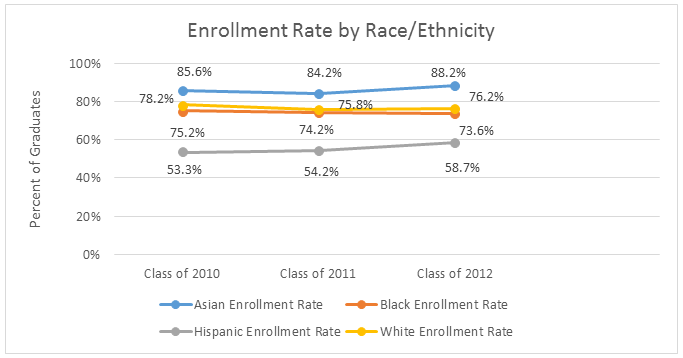
Asian graduates enrolled in post-secondary institutions at a higher rate than other races/ethnicities, topping 84% in all three years studied. White, Black, American Indian, and Pacific Islander graduates all enrolled at rates similar to one another, ranging from 71.8% to 76.2%. Hispanic graduates had the lowest enrollment rate of 58.7%. However, this was an increase from 53.3% for the class of 2010, one of the largest improvements across the period, by percentage points, of all subgroups. The number of Hispanic graduates also grew significantly during the period studied.
Figure 3 shows enrollment data by race/ethnicity.
Note: Due to space constraints, groups comprising less than 3% of the total population are not featured
Enrollment of Economically Disadvantaged Graduates
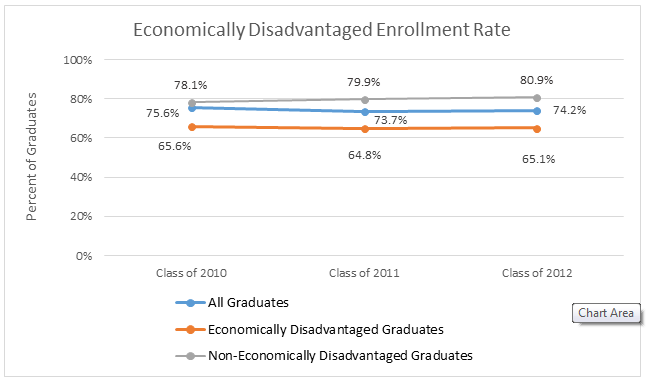
Graduates qualifying for free or reduced-price lunch (FRL) made up a significant portion of the total population, particularly in the class of 2012, when they comprised 42.3% of all graduates. Students in this group had a 65.1% enrollment rate, which demonstrated very little change for all three cohorts. This rate is 13 to 15 percentage points below the enrollment rate for non-economically disadvantaged graduates.
Figure 4 shows the data for Economically Disadvantaged students.
Trends in Credit Completion
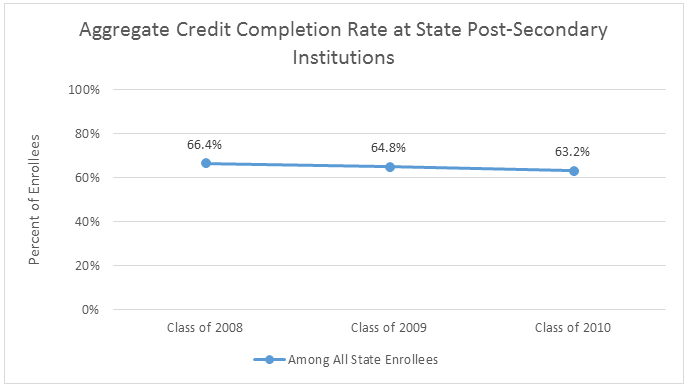
To establish trends in college enrollment, this education update examines data from the high school graduating classes of 2008, 2009, and 2010.[7] Data drawn during this period reflect public high school graduates who enrolled in a Georgia post-secondary institution and subsequently earned 24 credit hours (roughly equivalent to one year of college instruction) within their first two years.[8] The credit completion rate was 63.2% for the class of 2010, which is a decrease of 3.2 percentage points during the period studied.
Figure 5 shows Georgia graduates’ aggregate credit completion data for state post-secondary institutions.
Credit Completion by Gender
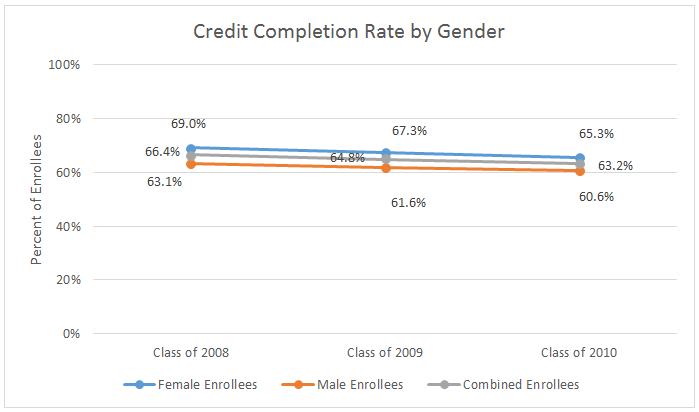
Females completed 24 credit hours in two years at a higher rate than males for all three classes of graduates. For the class of 2012, female students exhibited a credit completion rate of 65.3%, compared to 60.6% for males. Both genders showed a decline in completion rates for each year in the period studied.
Figure 6 shows credit completion data by gender.
Credit Completion by Race/Ethnicity
Asian enrollees had higher credit completion rates than other races/ethnicities, topping 82% in all three years studied. White enrollees had the next highest credit completion rate (69.4%), followed by Pacific Islanders (68.0%), enrollees identifying as two or more races/ethnicities (65.1%), American Indians (61.5%), Hispanics (60.8%), and Black enrollees (51.4%). In all groups for which data were available over the three-year period, completion rates declined slightly.[9] Black enrollees also experienced one of the largest drop-offs in completion over the period, falling 4.7 percentage points.
Figure 7 shows credit completion rates by race/ethnicity.
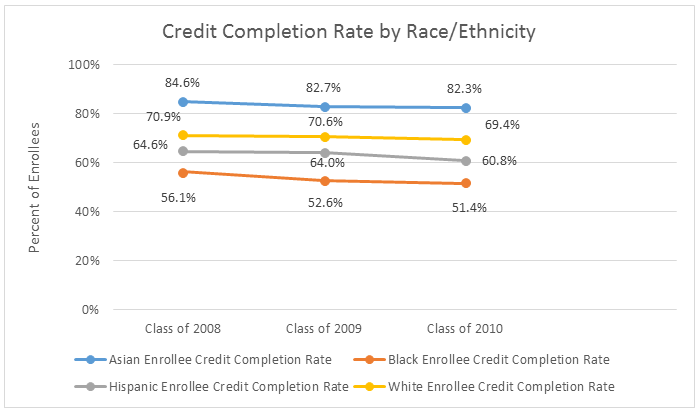
Note: Due to space constraints, groups comprising less than 3% of the total population are not featured.
Credit Completion of Economically Disadvantaged Enrollees
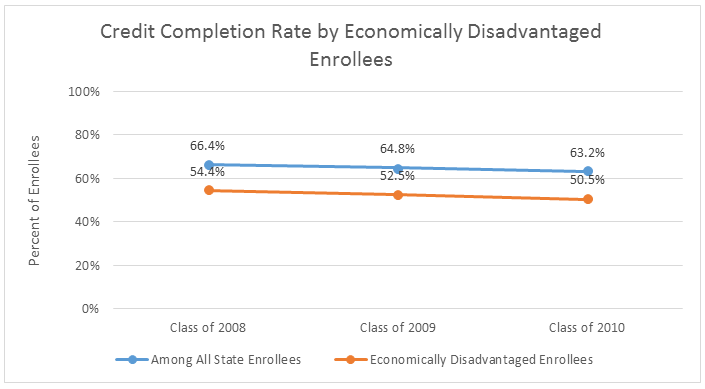
Graduates who had qualified for free or reduced-price lunch (FRL) comprised 35.3% of enrollees. These students had a lower credit completion rate (50.5%) than the statewide population. The rate for FRL students declined over the period studied.
Figure 8 shows the credit completion rates for FRL students.
Summary
Aggregate enrollment rates remained generally flat over the period studied. When disaggregated by race/ethnicity, the data show Asian graduates with the highest enrollment rates. Black and White graduates exhibit similar enrollment rates. Hispanic graduates’ enrollment rate was the lowest among all racial/ethnic groups but demonstrated a strong increase, rising from 53.3% for the class of 2010 to 58.7% for the class of 2012. A comparison of genders reveals a significant disparity in enrollment, with females from the class of 2012 ahead of males by 10.9 percentage points.
Credit completion rates for graduates at Georgia post-secondary institutions fell slightly over the period studied from 66.4% to 63.2%. Compared to enrollment rates, Georgia students were more stratified by race/ethnicity for credit completion, with the rates for minority students much lower than those for White and Asian students. Credit completion also showed a gap between the genders, with females achieving a rate of 65.3%, versus 60.6% for males.
[1] These federally-required reports are provided to the United States Department of Education.
[2] Unless otherwise noted, all enrollment information pertains to the class of 2012.
[3] Information from all public colleges and universities is included in the report. Beginning with the 2012-13 school year, seven private colleges/universities provided data that are included in the c12 report.
[4] Unless otherwise noted, all credit completion information pertains to the class of 2010.
[5] Enrollment information comes from the GOSA Report Card’s Downloadable Data files.
[6] The counts presented below are from GA•AWARDS, which is pulled from GaDOE Student Record. As such, they will not directly match the counts on the “Indicators and Demographics” section of the Report Card because the GaDOE uses a different data collection, October FTE, to calculate graduates.
[7] Credit completion information also comes from the GOSA Report Card’s Downloadable Data files.
[8] See endnote 3.
[9] Pacific Islanders and enrollees identifying as two or more races/ethnicities had too few results to be counted in the first two years of the period.