Grading Alignment Among Georgia's High Schools
February 3, 2009
States, including Georgia, are moving toward greater use of End of Course Tests (EOCTs) as high school exit exams. According to a report published on August 13th, only four states used some form of EOCT as a graduation requirement in 2007. By 2015, at least 11 states will use EOCTs as a high school exit requirement. While the list of 11 states does not currently include Georgia, state law (O.C.G.A. § 20-2-281) calls for the Georgia High School Graduation Test to be replaced by EOCTs "according to a schedule to be determined by the state board," and the state is already moving in this direction.
EOCTs are tied more closely to classroom instruction than are other types of exit exams, and currently in Georgia, EOCTs count for 15 percent of a student's final course grade. With the importance of EOCTs set to grow, it may be worthwhile to examine the relationship between grading practices and EOCT results. Both measures are based on the same state curriculum. A lack of alignment between the two - if a significantly greater percentage of students passed a course than passed the EOCT, for example - could indicate grade inflation. Research suggests a growth in grade inflation nationwide since the early 1990s. Grade point averages seem to be rising faster than other forms of student achievement, such as the ACT. In Arizona, a newspaper investigation found that many students who could not pass state assessments were awarded passing grades in their classes.
Given 1) the growing importance of EOCTs; 2) that EOCTs, because they immediately follow classroom instruction, should show outcomes that are somewhat aligned to course grades; and 3) that Georgia has embarked upon a complete overhaul of its curriculum, it is important to ask: How do Georgia's school systems fare when their high school grading alignment practices are examined?
Grading Alignment in Georgia High Schools
Recently, the Governor's Office of Student Achievement (GOSA) commissioned Dr. Christopher Clark, an Economics professor at Georgia College and State University, to study the alignment of local school systems' grading practices with their EOCT results. Using data obtained from the 2006-07 school year, Dr. Clark analyzed the alignment between Georgia students' EOCT performance levels and the grades they earned in related courses. Why is the relationship between the two important? His findings suggest that these disparities may impact: a) college success, b) HOPE Scholarship retention rates, and c) students' need for learning support (i.e. remedial classes) in college.
A Look at the State-Level Grading Alignment
Each of the following three tables represents a different aspect of Dr. Clark's results for the state of Georgia as a whole. Similar tables containing results for each school system in which more than 100 students were tested are posted under the research projects section of GOSA's website. (The section also includes details on the study's methodology).
Table 1: Statewide EOCT Exceeds Rates by Course Grade
The table below shows the percentage of students exceeding standards (i.e. scoring at the highest level) on each EOCT by the grade they received in each course. For example, 76.98% of the students statewide who earned an A in Algebra I also exceeded standards on the Algebra I EOCT. This table also shows that 8.38% of students who failed their Economics course actually exceeded standards on the Economics EOCT.

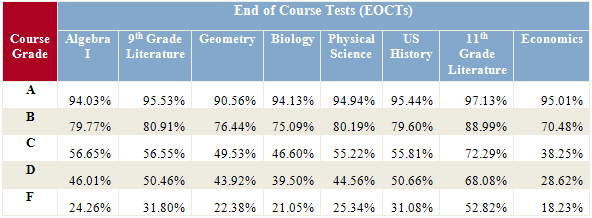
Table 2: Statewide EOCT Meets + Exceeds Rates by Course Grade
The second table shows the percentage of students who either met or exceeded standards on each EOCT by course grade. For example, 94.03% of the students statewide who earned an A in Algebra I also met or exceeded standards on the Algebra I EOCT:

Table 3: Statewide EOCT Failure Rates by Course Grade
The last table shows the same data in Table 2 from the opposite perspective: the percent of students who failed each EOCT, by course grade. For example, 5.97% of the students statewide who earned an A in Algebra I also failed the Algebra I EOCT. In this case, one might reasonably expect that students who earned high course grades had low failure rates on the EOCTs.

What Does the Data Look Like for Individual School Systems in Georgia?
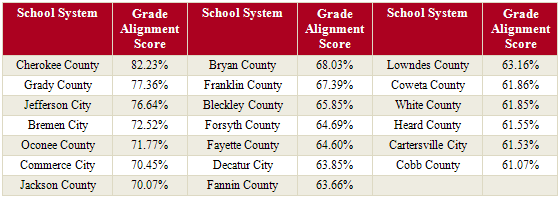
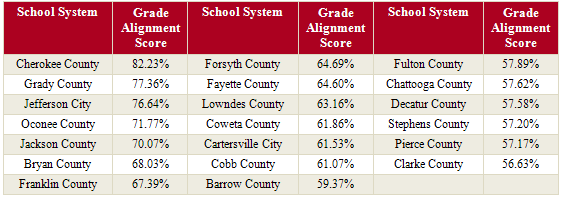
To arrive at a numerical value to represent each school system's grading practices across subject areas, GOSA compared students who earned high course grades AND high EOCT scores against students who only earned high course grades. GOSA divided the total number of students who earned an A, B, or C in each course AND who exceeded standards on the EOCT by the total number of students who earned an A or B in the course. (i.e. [A+B+C students who exceeded EOCT standards] ÷[A+B students]). It would be reasonable to assert that such school systems whose students exceeded standards on the EOCTs and who earned an A, B, or C in the course have high grading practice integrity. This ratio is presented below as the "Grade Alignment Score."
Using the method, if GOSA scored systems based only on the EOCTs in which they had 100 or more test takers on at least one EOCT, the list of top 20 looks like the table below (158 systems):

Using the same method, the table below shows the 20 systems with at least 100 test takers on all eight EOCTs (95 systems) who earned the highest score for their course grading practices.


Looking at this data in other ways provides slightly different pictures of school systems' grading practices.
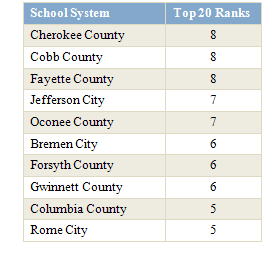
For example, some school systems consistently had a high percentage of students who earned C course grades but who exceeded standards on EOCTs. In other words, even the "average" students in these systems consistently scored well on statewide standardized assessments in multiple subject areas.
The table to the right shows school systems that were consistently among the top 20 systems statewide in terms of the percentage of their C students who exceeded standards on each EOCT. This table lists the systems and the number of EOCTs (out of 8) on which they had a top-20 ranking in the percentage of C students scoring at the Exceeds performance level. These systems have grading practices such that even students with average grades score well on standardized tests.
Conversely, a few systems consistently assigned "A" grades to students who scored at the Did Not Meet (DNM) standards performance level on the EOCTs. This would indicate inflated grades across subject areas. The systems who landed in the top 20 statewide in terms of the percentage of A students who scored DNM on 5 or more EOCTs were Atlanta Public Schools, Clayton County Public Schools, and Crawford County Schools. As stated above, EOCTs count for 15 percent of a student's course grade. This means that poor performance on an EOCT leads directly to a lower grade; therefore, the part of the grade determined by teachers may be even more inflated than these data suggest.
Conclusion
The conclusion to Dr. Clark's research paper best sums up the information provided above. He found that "there are considerable grading disparities across Georgia's High School Algebra, English Literature, Biology, Physical Science, History, Geometry, and Economics classes. Comparing student's course grades to their End of Course Test (EOCT) scores indicates that some school systems appear to be inflating course grades relative to the EOCT scores considerably while others appear to hold their students to higher standards.
These disparities are disconcerting because they may impact college success, HOPE scholarship retention rates for HOPE scholars, and the need for learning support (remedial classes) in college. Students from schools and school systems that appear to consistently inflate grades may be less likely to succeed in college courses, less likely to retain the HOPE scholarship, and more likely to need to take remedial classes after enrolling in college than students from schools and school systems that hold their students to higher standards.
Future research should be undertaken to analyze the impact of grading disparities on later academic success. An examination of the impact that rigor in grading standards (or a lack of rigor) may have on a student's academic future should be performed once data on HOPE eligibility, HOPE retention rates, and performance in college courses become available for the students whose data were used in this study."
Read the full research report here.