K-12 Student Discipline Dashboard

July 3, 2019

By Haley Steed and and Zach Weingarten 

Overview

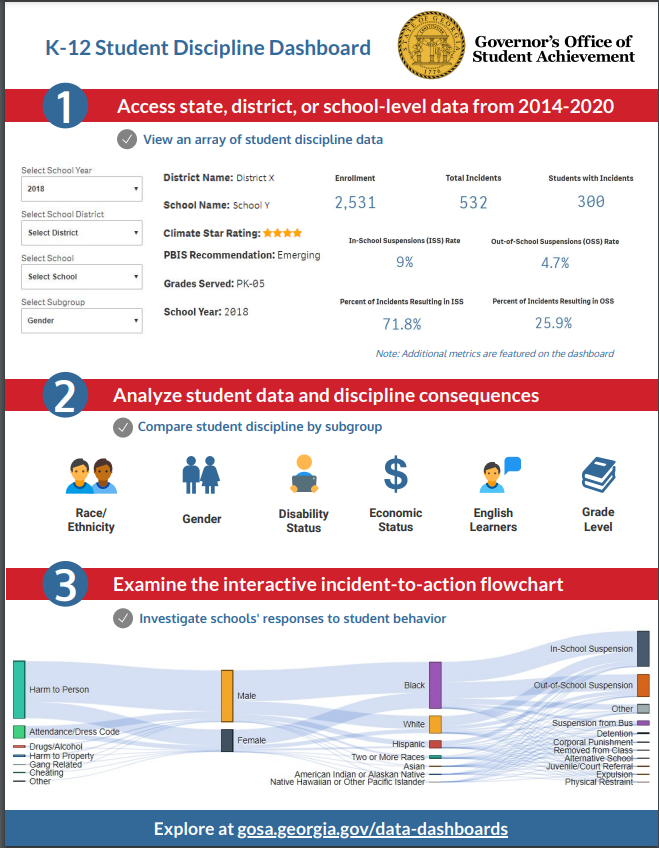
The Governor’s Office of Student Achievement’s K-12 Student Discipline Dashboard offers district- and school-level discipline data for all public schools in Georgia from 2014-2018.[1] The dashboard utilizes data from Georgia’s Academic and Workforce Analysis and Research Data System (GA•AWARDS) to examine discipline data by incident type and demographic subgroup. Stakeholders can use the dashboard to better understand trends in school discipline and address discipline issues.

Dashboard Functions

  • The dashboard displays information on the count of disciplinary incidents, in addition to student suspension and expulsion rates for 2014-2018.
  • Users can view data by six demographic subgroups: grade level, disability status, economic status, English Learner status, gender, and race/ethnicity.
  • An interactive incident-to-action flow chart shows the disciplinary actions schools took in response to each discipline incident type. The chart is broken down by race/ethnicity and gender, and it allows users to click select sections of the flow chart for more detailed information.

Statewide Discipline Statistics for K-12 Public Schools in 2018[2]

  • Approximately 8.7% of students in Georgia received at least one in-school suspension, and 6.1% of students received at least one out-of-school suspension.
  • Approximately 13.8% of students in the state had at least one discipline incident.
  • Harm to person was the most common discipline incident (65% of incidents).
  • Male students (51.4% of total enrollment) comprised 67.6% of disciplined students.
  • Black students (38.9% of total enrollment) comprised 56.4% of disciplined students.
  • Of students removed from class as a discipline consequence, 67.2% were black students.
  • Students with disabilities (13.5% of total enrollment) comprised 18.9% of the disciplined population.
  • Economically disadvantaged students (60.3% of total enrollment) comprised 76.1% of the disciplined population.
  • English Learners (6.7% of total enrollment) comprised 3.3% of the disciplined population.
  • 9th graders had the highest rate of disciplinary incidents (17.1% of all incidents).
  • 6th through 10th graders each made up over 11% of disciplinary incidents, whereas kindergarteners through 4th graders each made up less than 5% of incidents.


Overall vs. Disciplined pop by subgroup.PNG

How to Use the Dashboard

  • The infographic below shows the major functions of the dashboard.
  • The dashboard can be used in combination with the Schools Like Mine Dashboard to compare discipline rates at schools with similar demographic data.
  • The dashboard can be used in combination with the School Grades Reports website to better understand a school’s academic performance and School Climate Star Rating.
  • School- and district-level officials can use information from the dashboard to inform discipline policies.
K12Discipline_20


[1] GOSA will update the dashboard with additional data when available.


[2] All numbers were obtained from the Governor’s Office of Student Achievement K-12 Student Discipline Dashboard.