Analysis of the 2014-2015 CCRPI Scores
May 16, 2016
By Pascal Beaudette
On May 3, 2016, the Georgia Department of Education released the College and Career Ready Performance Index (CCRPI) scores for the 2014-2015 school year. Each school and district in the state receives a CCRPI score. This school year represents the fourth year of CCRPI scores. On average, this year’s scores are 1.9 points lower than the scores from 2013-2014. This education update summarizes the changes to the 2014-2015 CCRPI, provides summary statistics for the 2014-2015 scores, and compares these scores to previous years.
CCRPI Overview
The total possible CCRPI score is 110 points (100 points and 10 Challenge Points). The index includes the following components[1]:
| CCRPI Component | Points Available in 2014-2015 |
|---|---|
| Achievement | 50 |
| Progress | 40 |
| Achievement Gap | 10 |
| Challenge | 10 |
| Total | 110 |
Each school receives a separate score for each grade configuration (Elementary K-5, Middle 6-8, and High 9-12). In addition, each school receives an overall score that is a weighted average of enrollment in each grade configuration.
Changes to the 2014-2015 CCRPI
Compared to previous years, the 2014-2015 CCRPI contains the following changes.[2]
- Component weights
- In the 2014-2015 CCRPI, the weights of the components were adjusted to reward student growth and progress toward proficiency based on the state’s higher expectations associated with Georgia Milestones.[3] The Progress component now comprises a larger share of the total score, while the Achievement and Achievement Gap components account for a smaller share of the total score. The table below shows the points available by component in the 2014-2015 CCRPI compared to previous years.
Table 1: Point Values for CCRPI Components
| CCRPI Component | Points Available in 2014-2015 CCRPI | Points Available in Previous Years |
|---|---|---|
| Achievement | 50 | 60 |
| Progress | 40 | 25 |
| Achievement Gap | 10 | 15 |
| Challenge | 10 | 10 |
| Total | 110 | 110 |
- Calculation of Content Mastery achievement indicators
- Forty percent of the Achievement score is based on student performance on state tests. In 2014-2015, Georgia transitioned to the Georgia Milestones from the Criterion-Referenced Competency Tests (CRCT) and the End-of-Course Tests (EOCT). As a result, the indicators measuring performance on these tests changed. In the 2014-2015 CCRPI, Developing Learners are weighted at 0.5, Proficient Learners are weighted at 1.0, and Distinguished Learners are weighted at 1.5 when determining the percentage of students scoring at Developing Learner or above. Previously, these indicators used the percentage of students meeting or exceeding expectations.
- Calculation of Achievement Gap[4]
- The Achievement Gap score is comprised of two measures: gap size and gap change. The gap size measure has not changed. However, the gap change is now measured by assessing the mean SGP of the school’s lowest 25% of achievers during the previous school year. In the past, gap change was measured by the current year gap size minus the prior year gap size.
- Primary schools do not receive a score
- Primary schools (schools serving only Kindergarten through third grade students) will not receive a score in 2014-2015 because primary schools cannot earn points for Progress or Achievement Gap in the 2014-2015 CCRPI. This change applies only in 2014-2015. GaDOE plans to revise the calculation for primary schools for the 2015-2016 school year.
2014-2015 CCRPI Key Points
- When the scores are averaged for all schools, the average score is 72.1, a decrease of 1.9 points from the school average of 74.0 in 2013-2014.[5]
- Fourteen schools in seven districts received scores over 100, with the Gwinnett School of Mathematics, Science, and Technology receiving the highest score of 108.4.[6]
Table 2: CCRPI Summary Statistics[7]
| Average | Min. | Max. | |
|---|---|---|---|
| 2014-2015 Score | 72.2 | 30.6 | 108.4 |
| 2013-2014 Score | 73.4 | 21.3 | 100.4 |
- On average, elementary schools decreased by 2.6 points and middle schools by 4.6 points since 2013-2014.[8] High schools increased by 5.2 points, largely because high schools already had more challenging math assessments and graduation rates are higher than Georgia Milestones performance.
- 359 schools received a score 10 points lower than the 2013-2014 score, and 224 schools received a score that was 10 points higher.
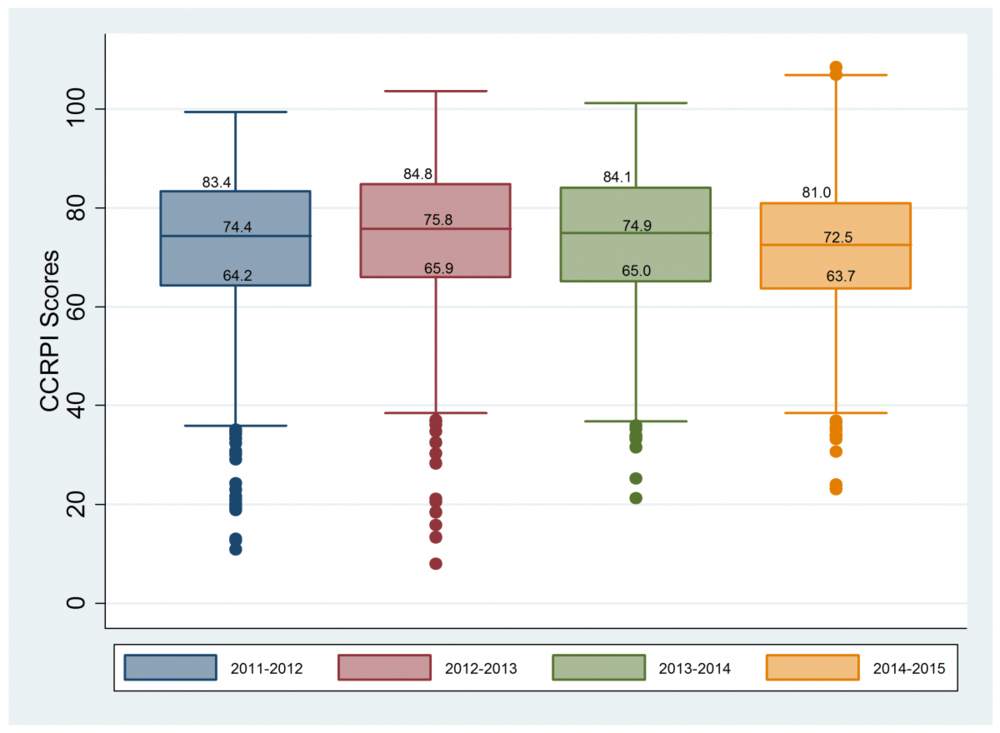
- The following plot shows the distribution of the CCRPI scores over the past four years. The boxes represent scores between the 25th and 75th percentiles. [9] In general, scores decreased in 2014-2015 when looking at the middle 50% of schools.

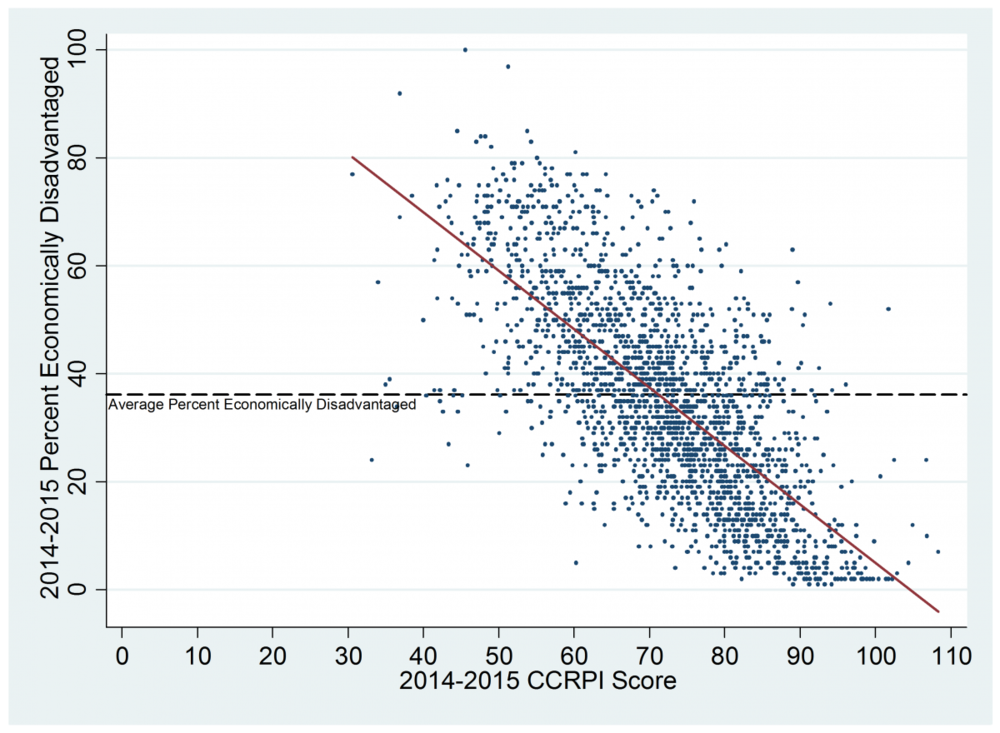
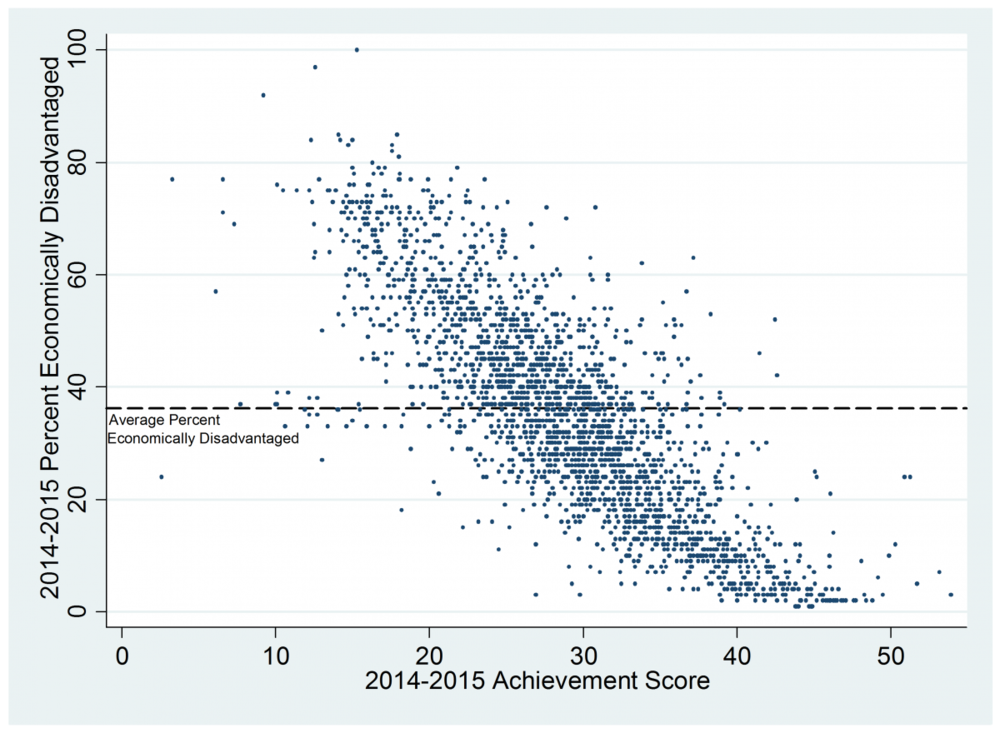
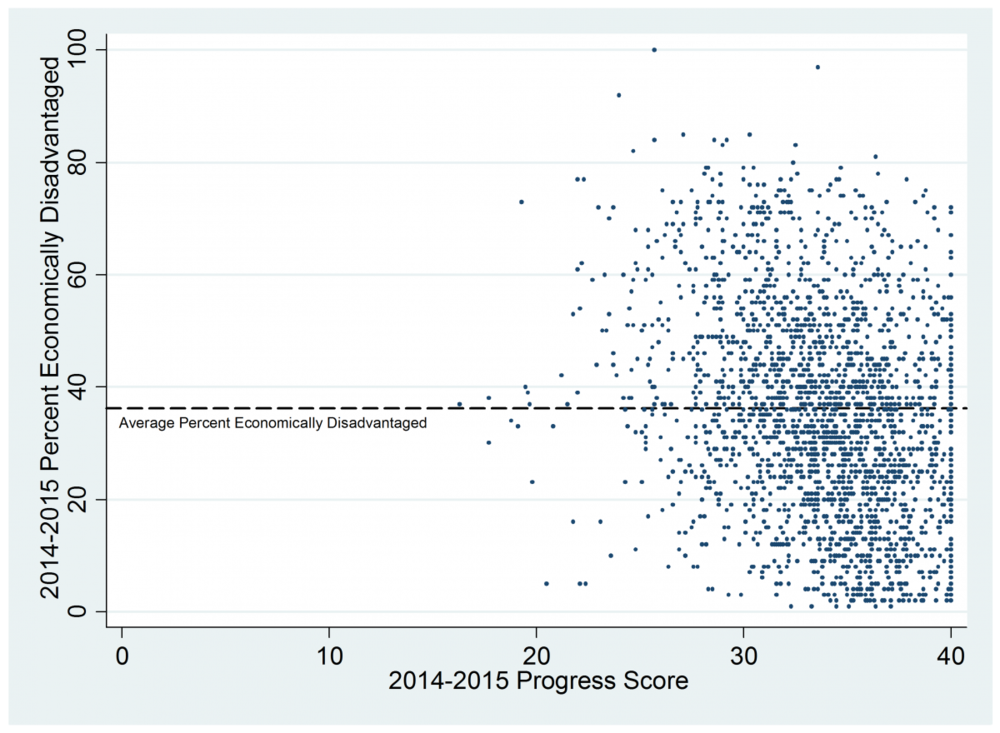
- Similar to past years, schools with a higher percentage of low-income students tend to have lower CCRPI scores, as seen below.[10] However, as the figures below demonstrate, the distribution of the Progress score is less related to the percentage of low-income students than is the Achievement score.

- In general, schools with high percentages of low-income students have lower Achievement scores, but some of these schools have very high Progress scores.[11]


Summary
Overall, scores in 2014-2015 are lower than in prior years. On average, the scores for elementary and middle schools decreased, while the scores for high schools increased, largely because high schools already had more challenging math assessments and graduation rates are higher than Georgia Milestones performance. Similar to past years, schools with a higher percentage of low-income students tend to score lower on the CCRPI largely because they tend to have lower Achievement scores. However, many schools with a higher percentage of low-income students have very high Progress scores.
In the coming days, GOSA will announce Single Statewide Accountability System (SSAS) awards for schools and release a parent-friendly school performance report that allows for easier comparison of CCRPI and other performance information between years and schools.
[1] For detailed information on these components, see this list compiled by GaDOE.
[2] Note that this is not an exhaustive list. For a more complete list of changes, click here.
[3] To read the GOSA education update on Georgia Milestones, click here.
[4] For more information on this change, click here.
[5] These averages differ from the published statewide scores because these averages treat every school equally regardless of school size.
[6] The seven districts are Atlanta Public Schools (1 school), DeKalb County (3 schools), Forsyth County (5 schools), Gwinnett County (1 school), Marietta City (1 school), Muscogee County (1 school), and Richmond County (2 schools).
[7] The numbers in this table do not include primary schools because these schools did not receive scores in 2014-2015. The numbers also do not include schools within the Department of Juvenile Justice (DJJ) because they received CCRPI scores for the first time in 2014-2015.
[8] Grade cluster differences were calculated by taking the difference of CCRPI scores for each cluster, not the Single Score.
[9] The boxes represent the scores between the 25th and 75th percentiles, with the line in the middle of the box representing the median (50th percentile). The whiskers represent the upper and lower adjacent values. The dots are the values that fall outside the adjacent values. Note that this plot includes all schools that received scores during these respective years.
[10] Historically, student eligibility for free/reduced-price lunch (FRL) served as a proxy for individual student/family income status. However, due to the recent expansion of the National School Lunch Program’s Community Eligibility Provision (CEP), FRL is no longer an accurate measure of student income status. For this reason, this education update uses directly certified students as a measure of poverty rather than FRL. For more information, click here to read GOSA’s education update on measures of student poverty.
[11] In the plots below, each school-grade cluster combination represents one dot. In other words, if a school receives Achievement points for both its elementary grades and its middle school grades, it appears on the plot twice.