
Analysis of 2016 Financial Efficiency Star Ratings
January 26, 2017
By Pascal Beaudette
On January 26, GaDOE and GOSA released the 2016 FESR for each school district in the state.[1] This rating uses a three-year average (2013-2014, 2014-2015, and 2015-2016) of per pupil expenditure (PPE) and College and Career Ready Performance Index (CCRPI) scores to determine the rating.[2] This education update analyzes the 2016 Financial Efficiency Star Ratings (FESR) and investigates the relationship between PPE and other district characteristics.
FESR Calculation
To calculate a star rating, GOSA uses the district’s three-year average CCRPI score and the percentile of the district’s three-year average PPE. The matrix below shows the method for determining the FESR using both the PPE percentile and the CCRPI scores. Districts can earn between a one-half star and five stars, with a one-half star rating for districts with the highest PPEs and low CCRPI scores, and a five-star rating for districts with the lowest PPEs and high CCRPI scores. For more details on the FESR calculation,
click
here for the calculation guide
.
Table 1: Star Rating Matrix

Changes to the FESR
GaDOE and GOSA first released district-level FESRs in 2015. The 2016 FESR excludes more categories of expenditures than the 2015 FESR. At the request of district stakeholders, the calculation now excludes expenditures from residential treatment centers (RTCs) and some payments to charter schools, which were included in 2015. The district enrollment counts also do not count enrollment from RTCs or schools that do not report expenditures. As a result, one cannot directly compare the 2016 and 2015 FESR data.
2016 FESRs
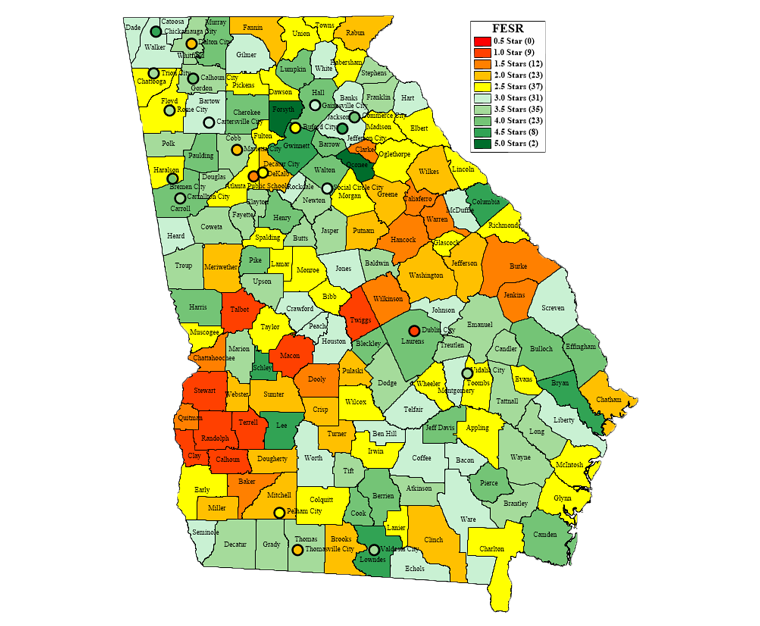
At the opposite ends of the FESR scale, no districts earned a one-half star, and two districts earned five stars (Forsyth County and Oconee County). Overall, districts averaged 2.8 stars. As seen in the map below, a cluster of districts in southwest Georgia receive ratings of 1 and 1.5 stars, while the area around metro Atlanta has a number of districts with ratings of 4.0 stars or above.
Figure 1: Map of 2016 FESR
Patterns in Per Pupil Expenditures
Below are summary statistics for the three-year state average PPE and the PPEs in each year.
Table 2: PPE Summary Statistics (n=180)
| Min | State Average | Max | |
|---|---|---|---|
| FY14 | $5,791 | $8,376 | $14,261 |
| FY15 | $4,239 | $8,654 | $16,522 |
| FY16 | $5,003 | $8,950 | $21,049 |
| 3-Year Average | $5,840 | $8,660 | $17,277 |
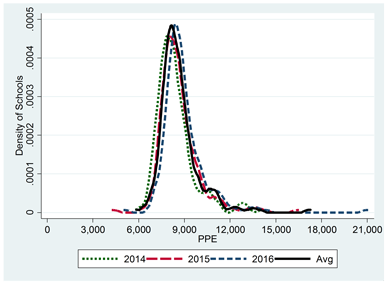
The three-year state average of calculated PPEs is $8,660. Over 71% of districts have an average PPE between $7,000 and $9,000. The plot below shows the distribution of PPEs for each fiscal year and the average PPE. FY14 and FY15 show similar distributions, but the distribution for FY16 is moved slightly to the right, signifying increased expenditures.
Figure 2: Distribution of PPE
Relationship with Other Characteristics
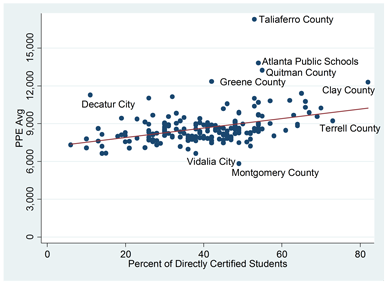
As seen in the following plots, there is not a strong relationship between PPE and the percentage of students with disabilities or district enrollment.[3] There is a positive relationship between PPE and the percentage of students who are economically disadvantaged, meaning districts with a high percentage of economically disadvantaged students tend to have high PPEs.[4] However, several schools with a high percentage of economically disadvantaged students have below average PPEs.
Figure 3: Average PPE and Percentage of Students with Disabilities
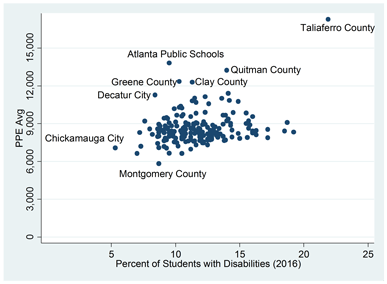
Figure 4: Average PPE and District Enrollment[5]
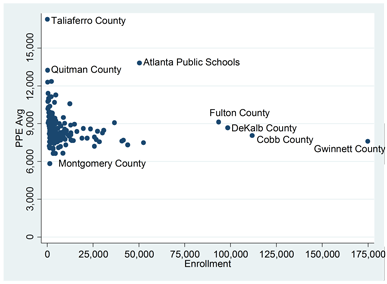
Figure 5: Average PPE and Percentage of Directly Certified Students[6]
Metro and Non-Metro District Comparison
When districts in metro Atlanta are compared to non-metro districts, the non-metro districts have an average PPE approximately $300 less than districts in metro Atlanta.[7] However, Atlanta Public Schools (APS) largely drives the higher metro average; APS has the second highest average PPE ($13,807) in the state. When APS is excluded, the metro Atlanta average is $67 less than the average for the non-metro districts.
Table 2: Metro and Non-Metro District Comparison
| Total Districts | Average PPE | |
|---|---|---|
| Non-Metro Districts | 166 | $8,636 |
| Metro Atlanta Districts | 14 | $8,943 |
| Metro Atlanta Districts (without APS) | 13 | $8,569 |
Going Forward
For next year’s Financial Efficiency Star Rating, GOSA and GaDOE will also release a school-level rating for the first time. Although all districts follow the same reporting guidelines and are able to report expenditures at the school level, analysis of the school-level data from 2015-2016 and earlier indicates inconsistencies in the use of school codes for expenditure reporting throughout the state. For these reasons, publicly releasing 2016 school-level financial ratings would not provide meaningful, accurate, or consistent comparisons.[8] To address this issue, in May 2016, the GaDOE Financial Review Division updated the guidance on reporting expenditures. Additionally, an update to State Board Rule 160- 5-2-.21 was adopted in May 2016 to clarify reporting to the school and facility level, which should result in more consistent reporting of expenditures at the school level.
[1] O.C.G.A. §20-14-33 requires that the Governor’s Office of Student Achievement (GOSA), in coordination with the Georgia Department of Education (GaDOE), create a financial efficiency rating. The law requires that GOSA and the GaDOE collaborate to “adopt and annually review, and revise as necessary, indicators of the quality of learning by students, financial efficiency, and school climate for individual schools and for school systems.” Financial efficiency “may include an analysis of how federal and state funds spent by local school systems impact student achievement and school improvement, and components used to determine financial efficiency may include actual achievement, resource efficiency, and student participation in standardized testing.” The rating must be based upon five stars.
[2] State schools (Atlanta Area School for the Deaf, Georgia, Georgia Academy for the Blind, and Georgia School for the Deaf) do not report their financial information separately using the Local Units of Administration Chart of Accounts. The state schools are operated by the Georgia Department of Education. Therefore, the financial activity of the state schools is reported in the State of Georgia Comprehensive Annual Financial Report but not in the data file used to calculate the FESR. As a result, these schools will not receive an FESR. Additionally, state charter schools do not receive a district rating.
[3] The percentage of SWD students in 2015-2016 is from GOSA’s Report Card. Directly certified counts are from GaDOE and represent the 2015-2016 school year. District enrollment is the enrollment number used in the FESR, which is derived from the GaDOE downloadable enrollment files ‘Enrollment by Ethnicity/Race, Gender and Grade Level’ and represent the October 2015 FTE counts.
[4] Economically disadvantaged is measured by direct certification. Directly certified students must either live in family units that receive Supplemental Nutrition Assistance Plan (SNAP) benefits or Temporary Assistance for Needy Families (TANF), and/or be homeless, unaccompanied youth, foster or a migrant.
[5] The same pattern holds when looking at only districts with less than 50,000 students.
[6] The same pattern holds when looking at only districts with an average PPE less than $12,000.
[7] The metro area is defined by the Atlanta Regional Commission as the ten-county metropolitan area (http://www.atlantaregional.com/about-us/the-region). In addition to these districts, the following metro area city school systems are also included: Atlanta Public Schools, Buford City, Decatur City, and Marietta City Schools.
[8] Because these concerns only affect the attribution of expenditures to the school level, the reliability of district-level expenditures is not a concern.