Number-of-Students-Taking-AP-Tests-Final_0.png

An official website of the State of Georgia.
The .gov means it’s official.
Local, state, and federal government websites often end in .gov. State of Georgia government websites and email systems use “georgia.gov” or “ga.gov” at the end of the address. Before sharing sensitive or personal information, make sure you’re on an official state website.
Still not sure?
Call 1-800-GEORGIA to verify that a website is an official website of the State of Georgia.
May 30, 2017
By Brian Delgado and Prateek Paul
In recent years, Georgia schools and districts have sought to expand high school students’ access to college-level coursework. One of those opportunities is the College Board’s Advanced Placement (AP) program, which provides college-level courses taught by trained high school teachers within the high school setting. Students who take AP courses have the option of taking an accompanying AP exam and potentially receiving college credit for scoring three or above on the test. Currently, there are 38 different AP courses offered throughout Georgia.[1] Using data from GOSA’s Report Card, this education update summarizes trends in AP over the past five years in Georgia public schools.[2]
AP courses target students who are academically prepared and motivated to take college-level courses. Students also take AP courses to earn college credit and be more prepared for college-level work. If students decide to take the AP exam, they can score between a one and five, with a score of three or higher considered passing by the College Board. Students may be eligible to receive college course credit in a corresponding subject of the AP exam if their score meets the criteria established by their respective college/university. AP tests are grouped into the following categories:[3]
|
AP Capstone (2) [4] |
Seminar, Research |
|
Arts (5) |
Art History, Music Theory, Studio Art 2-D Design, Studio Art 3-D Design, Studio Art Drawing |
|
English (2) |
English Language & Composition, English Literature & Composition |
|
History & Social Sciences (9) |
Comparative Government & Politics, European History, Human Geography, Macroeconomics, Microeconomics, Psychology, United States Government & Politics, United States History, World History |
|
STEM (12) [5] |
Biology, Calculus AB, Calculus BC, Chemistry, Computer Science A, Computer Science Principles, Environmental Science, Physics 1, Physics 2, Physics C: Electricity and Magnetism, Physics C: Mechanics, Statistics |
|
World Languages & Cultures (8) [6] |
Chinese Language and Culture, French Language and Culture, German Language and Culture, Italian Language and Culture, Japanese Language and Culture, Latin, Spanish Language and Culture, Spanish Literature and Culture |
To establish trends in AP tests and performance, this education update examines five years of high school data from 2011-2012 to 2015-2016, the most recent data available.[7]
The number of students taking AP tests in Georgia has increased gradually each year, growing from 68,259 to 84,697 (24.1%) from 2011-2012 to 2015-2016. This increase is consistent with national trends; the number of public school students taking AP tests nationwide grew by 24.9% from 2011-2012 to 2015-2016.[8]
The percentage of high school students taking AP tests has also increased by 2.1 percentage points from 14.8% in 2011-2012 to 16.9% in 2015-2016.[9] Of the districts in which students took AP tests, 60.4% saw an increase in AP test participation.[10] Six districts administered AP tests in 2015-2016 that did not administer in 2011-2012. The largest increase in Georgia’s AP test participation rate occurred between 2011-2012 and 2012-2013, when the rate increased by 1.3 percentage points. Since 2013-2014, the AP test participation rate has remained relatively stable statewide. Telfair County experienced the greatest growth, with a 21.6 percentage point increase from 3.1% in 2011-2012 to 24.7% in 2015-2016. Decatur City, Forsyth County, Fulton County, and Oconee County consistently had the highest AP test participation rates (above 30% in all five years).

The percentage of tests with a passing score (three or higher) increased by 1.8 percentage points over the course of five years, with 56.4% of tests having a three or higher in 2015-2016.[11] Over these five years, Georgia’s average pass rate (54.6%) has been slightly below the national average (56.7%).[12] Pass rates remained constant across most subject categories over the five years. The subject pass rates have also been very similar to the statewide average pass rate over the five-year span, with the exception of the World Languages & Cultures and Arts categories for which pass rates were higher than the statewide average.[13] However, it is important to point out that there were significantly fewer tests administered in the World Languages & Cultures and Arts categories per year than in the English, History & Social Sciences, and STEM categories (see Figure 3), which may be affecting the higher pass rates for these exams.[14]

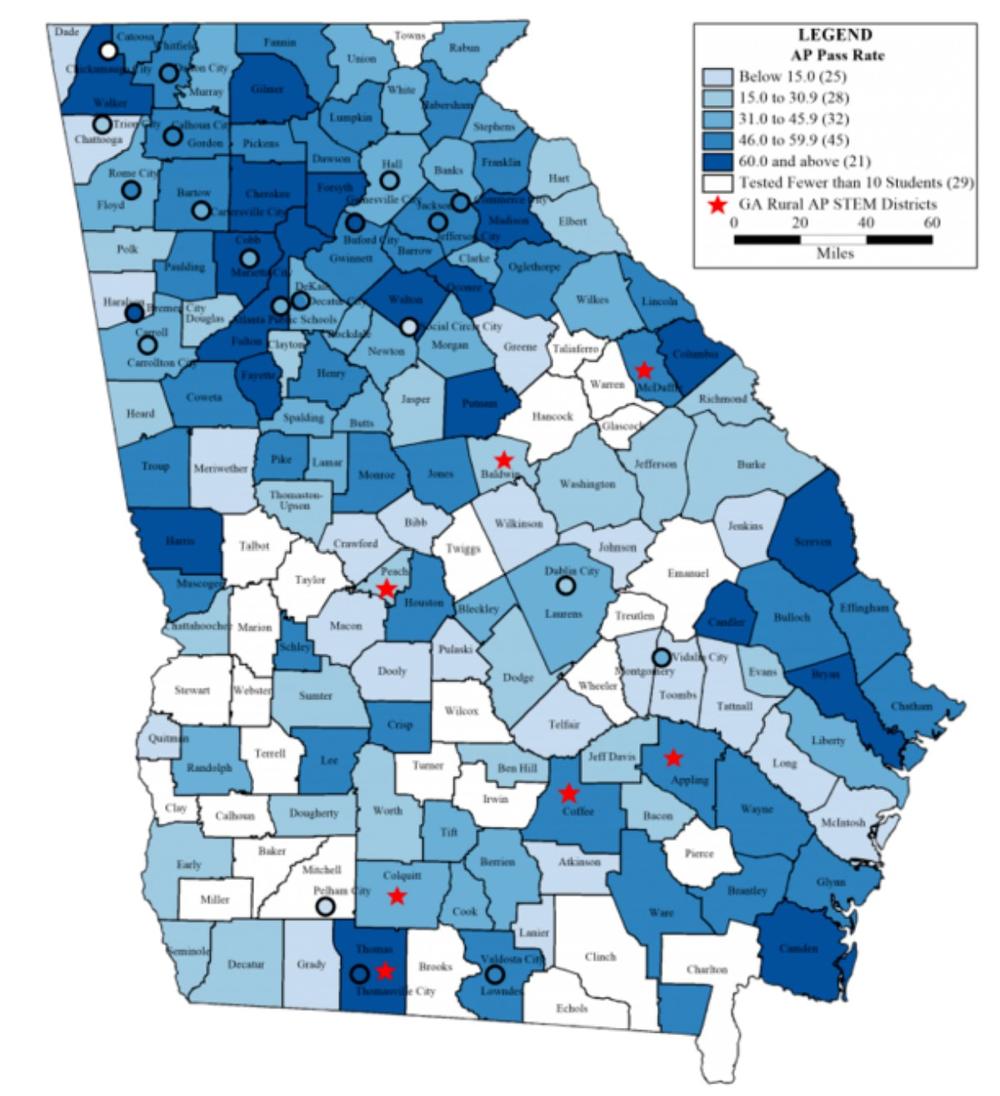
The map below shows AP pass rates by district in 2015-2016.[15] The shades of blue represent different pass rates, with dark blue representing high pass rates and light blue representing low pass rates.[16] The districts in white had fewer than ten students taking AP tests and were thus excluded due to privacy reasons.[17] The red stars mark the seven districts that were awarded grants through Governor Deal’s Georgia Rural AP STEM Initiative, which intends to build capacity and expand AP course offerings in districts with limited AP participation (see inset box for more information).
Most of the districts with high pass rates are concentrated around metro Atlanta and the northern and southeastern parts of the state. Many districts in central and southwest Georgia did not administer any AP tests or had pass rates lower than 15%.
| Georgia Rural AP STEM Initiative |
|---|
|
As part of a partnership between GOSA and College Board, seven districts were chosen to take part in the Georgia Rural AP STEM Initiative, which aims to support rural school districts in implementing successful AP programs in STEM areas. Through teacher professional learning and coaching support, these rural districts have the opportunity to develop AP programs for up to three specific STEM-related courses: Computer Science A, Computer Science Principles, and Statistics. The seven award winners and their selected AP STEM pathways are:
|
Overall, the number of AP tests taken and tests with a passing score increased over the five-year span from 2011-2012 to 2015-2016 across all subject areas. Pass rates remained relatively constant over this period.[18], Georgia’s AP test participation rate increased slightly from 14.8% in 2011-2012 to 16.9% in 2015-2016. Geographically, districts with high AP pass rates are more concentrated around Atlanta and the northern and southeastern parts of Georgia, while several districts in central and southwest Georgia had few or no AP tests administered. In general, AP participation continues to grow in high schools across Georgia, and through programs such as the Georgia Rural AP STEM Initiative, participation may increase participation even further.
[1] Visit College Board to learn more about AP Courses.
[2] This education update uses the most recent data available: school years 2011-2012 through 2015-2016. It does not feature data from private schools.
[3] GOSA used the categories listed on the AP Course Home Pages site.
[4] The AP Capstone Seminar test was only taken in Georgia in 2014-2015 and 2015-2016, while the AP Capstone Research test was only taken in Georgia in 2015-2016.
[5] The AP Computer Science Principles test has not yet been administered in Georgia. The AP Physics B test was replaced by the AP Physics 1 and 2 tests starting in 2014-2015.
[6] The AP Italian Language and Culture test was taken in Georgia in 2011-2012 and 2012-2013. The AP Latin: Vergil test became AP Latin in 2012-2013.
[7] The data include school information, the number of AP students tested, the number of AP tests administered, and the number of tests with passing AP scores (three or higher) for students in 9th through 12th grade.
[8] GOSA calculated the national percentage using College Board’s annual AP program participation data.
[9] GOSA calculated the AP test participation rate by dividing the number of students who took AP tests by the total number of students enrolled in grades 9 through 12.
[10] This figure only includes districts that administer AP tests in both school years and excludes state charter schools.
[11] The number of passing scores declined slightly for Arts tests from 2012-2013 to 2013-2014 and English tests from 2011-2012 to 2012-2013 and 2014-2015 to 2015-2016. All other subjects saw increases in the number of tests with a passing score from year to year.
[12] GOSA calculated the national public school pass rates using College Board’s annual AP program participation data. The average national public school pass rate for 2011-2012 to 2015-2016 is 56.7%.
[13] The significant growth in World Languages & Cultures pass rates is largely due to a 23 percentage point increase in the most frequently administered foreign language test, Spanish Language, over the five-year period. Between 2012-2013 and 2013-2014, Spanish Language pass rates increased by 22.2 percentage points from 65.7% to 87.9%.
[14] It is important to keep in mind the number of test in each category. In 2016, there were 2,730 Arts tests, 25,651 English tests, 72,736 History & Social Sciences tests, 42,971 STEM tests, 3,434 World Languages & Cultures tests. The low number of Arts and World Languages & Cultures tests could be indicative of a selection effect of who takes these AP exams and may explain the higher scores.
[15] State charter schools and state schools are not included in this map.
[16] The bins for each shade of blue were determined using the “optimal breaks” method in Maptitude 2015. The “optimal breaks” method minimizes within-group variance using the Fisher-Jenks Algorithm version of the Optimal method of irregular class creation.
[17] In 15 districts, no students took AP tests in 2015-2016. In 17 districts, fewer than 10 students took tests, and GOSA does not report outcomes for fewer than 10 students.
[18] With the exception of tests in the World Languages & Cultures category, as discussed above.